Conditional Formatting

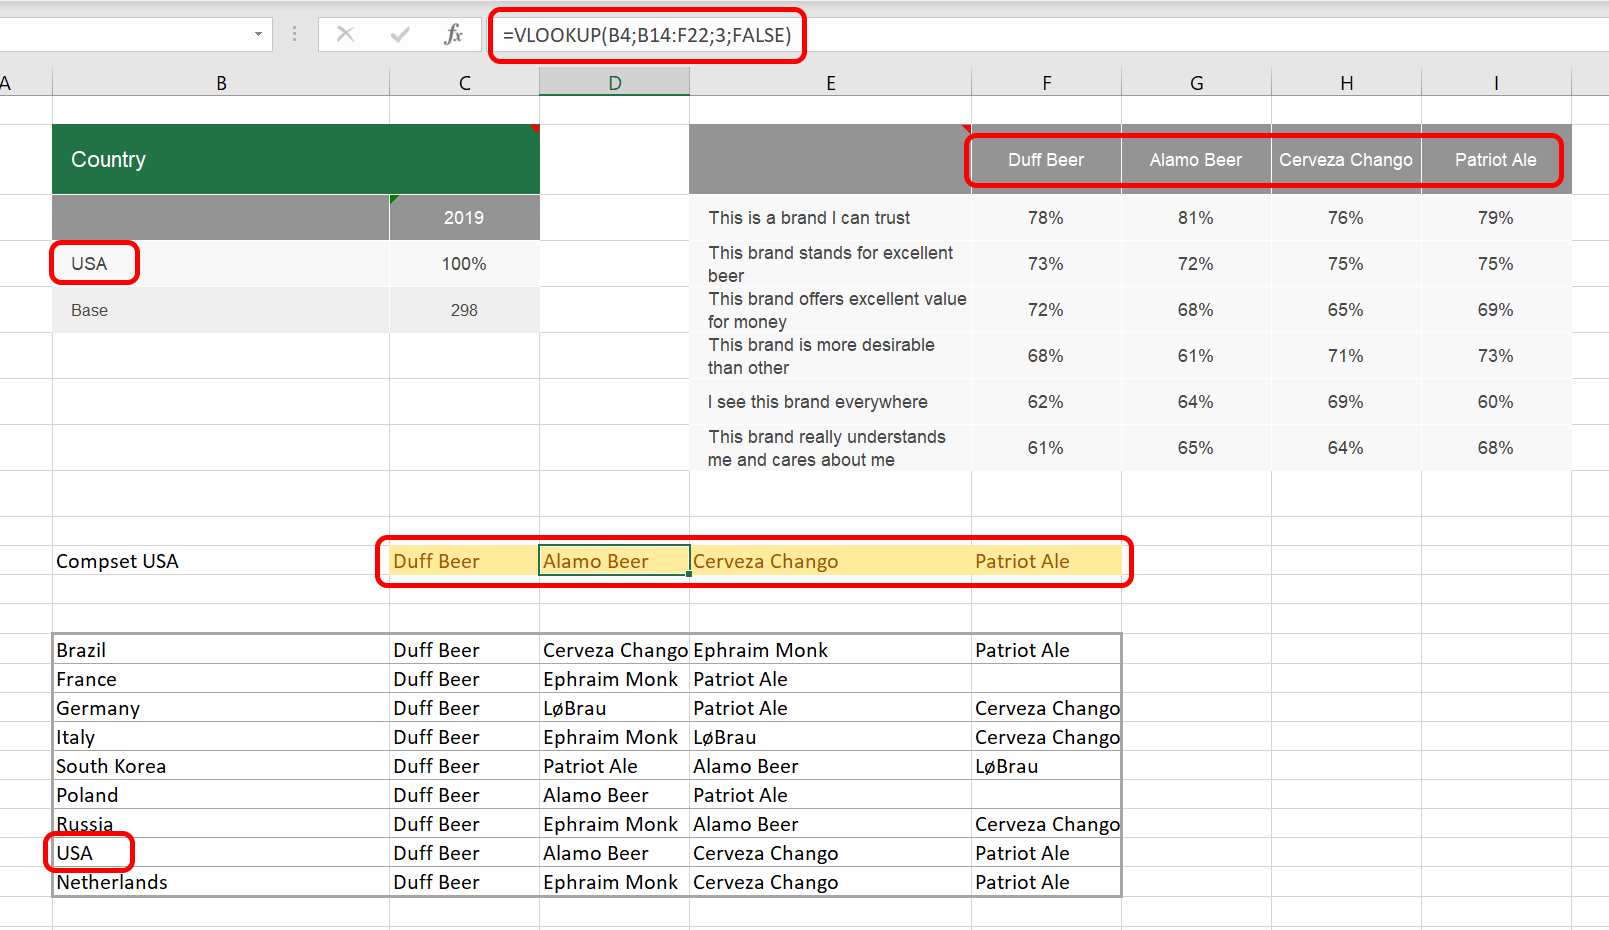
Define 'Conditional Formatting' in Excel, and show the results in a PowerPoint Table. The picture on the side is exactly showing that. Besides using the values from a specific range in Excel, OfficeReports can use the background color and the font size and color as well.

In the same way, it is possible to e.g. color different regions in a map.

Excel Formulas

In multi-national tracking surveys you might need to compare a specific brand to the biggest competitors in each country. OfficeReports can automate the process 100% by reading the 'compset' for a specific country from a lookup table in the workbook using Excel's VLOOKUP.

It is off course also possible to use formulas for calculation.

Native PowerPoint Tables, Charts and Shapes

Quite some of our competitors only export pictures to PowerPoint, which makes e.g. resizing impossible. In case you need to make a new export because of e.g. changes in the data set, you will loose the changes you already have made to the presentation.

OfficeReports does not change the tables, charts and shapes in your presentation. OfficeReports populates them with data from specific ranges in Excel, and remembers which ranges you have used. This makes it possible to update the presentation with new data and still preserve the changes you have made. Even defined animations will still work.

VBA macros

OfficeReports can automatically run a macro when creating/updating a crosstab in Excel or when populating a table chart or shape in PowerPoint with data.

On the picture you can see how a macro has added curly bracket to a column chart to show the Top 2 results.

Macro's cannot only change crosstabs or PowerPoint tables, charts and shapes, macro's can change everything in the entire Excel workbook or PowerPoint presentation