Welcome to Presento – Your Data Visualization Companion for PowerPoint!
Presento simplifies the process of integrating data into your PowerPoint presentations. It's the bridge between Excel workbooks and PowerPoint slides, designed to make data visualization effortless.
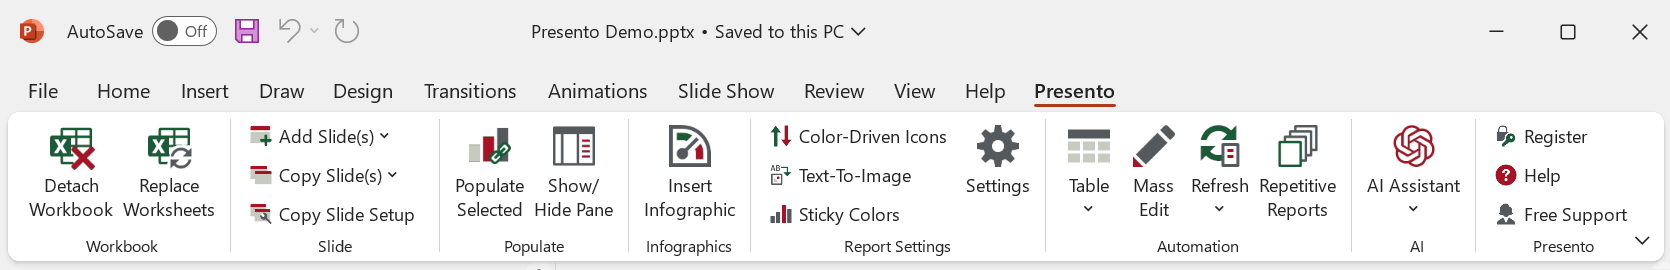
Key Features:
- Seamless Workbook Integration: Presento seamlessly links Excel workbooks to PowerPoint shapes, tables, and charts, allowing you to use your data directly within your presentations. The workbook is displayed in the 'Presento Workbook Pane' a workspace that closely mirrors Excel's functionality, complete with formulas and Conditional Formatting.
- Enhanced Visualizations: Elevate your presentations with dynamic visual elements. Automatically add images and icons, and explore a wide range of chart types, such as 'Rotated Line Chart,' 'Diverging Bar Chart,' 'Quadrant Chart,' and infographics like sliders and Gauge charts, among others.
- Data Updates: Keep your presentations current. Modify your linked Excel workbook, then simply click 'Refresh' to update your PowerPoint with the latest data.
- Preserve PowerPoint: Your resulting presentation remains in native PowerPoint format, featuring PowerPoint tables, charts, and shapes. Share and collaborate effortlessly with anyone using PowerPoint.
In this introduction, we'll focus on the most commonly used features. Explore the sections below to gain a deeper understanding of the aspects that matter most to you. Get ready to enhance your data visualization capabilities with Presento!
Getting Started
Create a new presentation or open an existing one. In the 'Presento' ribbon tab, click 'Attach Workbook' and choose the workbook containing the data you need to visualize in PowerPoint. Learn more about Attaching a Workbook. Then have a look at some of the important Settings before you start creating your report.
Populate Tables, Charts and Shapes
After 'Attaching a workbook', you are ready to populate tables, charts and shapes using the data from the workbook.
Chart Types & Infographics
Specialized Chart Types: Presento simplifies the creation of complex chart types that can be challenging to build manually in PowerPoint. Explore options like the 'Rotated Line Chart,' 'Diverging Bar Chart,' 'Quadrant Chart,' and 'XY Chart with a label-table.' Learn more about Chart Types
Infographics at Your Fingertips: Elevate your presentations with dynamic infographics, including Sliders, Smileys (with automatic selection based on values, known as 'Signal Shapes' in Presento), and Gauge charts. Learn more about Infographics.
Fully Editable: All charts and infographics generated by Presento are constructed from native PowerPoint elements. This means you can modify them, even without having Presento installed.
Color-Driven Icons
Utilizing the font and fill colors of linked cells within your workbook, Presento enables the automatic incorporation of icons, such as arrows, into your tables and charts. This precision placement of icons eliminates the need for manual adjustments. Explore further details on Color-Driven Icons.
Text-to-Image
Seamlessly display images alongside linked texts or replace the text with images. Presento automatically handles image sizing and precise positioning, alleviating the need for manual adjustments. Delve deeper into Text-to-Image.
Sticky Colors
Always display a specific item, such as a brand or product, in a consistent color, regardless of its location in the chart. Learn more about Sticky Colors.
Automation
(Re)Organize the data
when the needed data is not easy to select, it might be necessary to reorganize the data. Read more about Lookup Tables, Lookup Ranges and Linked Ranges.
AI Assistant
Get help formulating any texts or analyzing tables and charts. Our AI assistant can give a hand.
It is a good idea to let OfficeReports organize the worksheets by attaching the worksheets to the slides. This way you can copy slides and you automatically get a copy of the attached worksheet, including the editable table definitions the worksheet might contain. This can make creating slides very fast. Read more about Productivity in PowerPoint.