Populate a PowerPoint Table
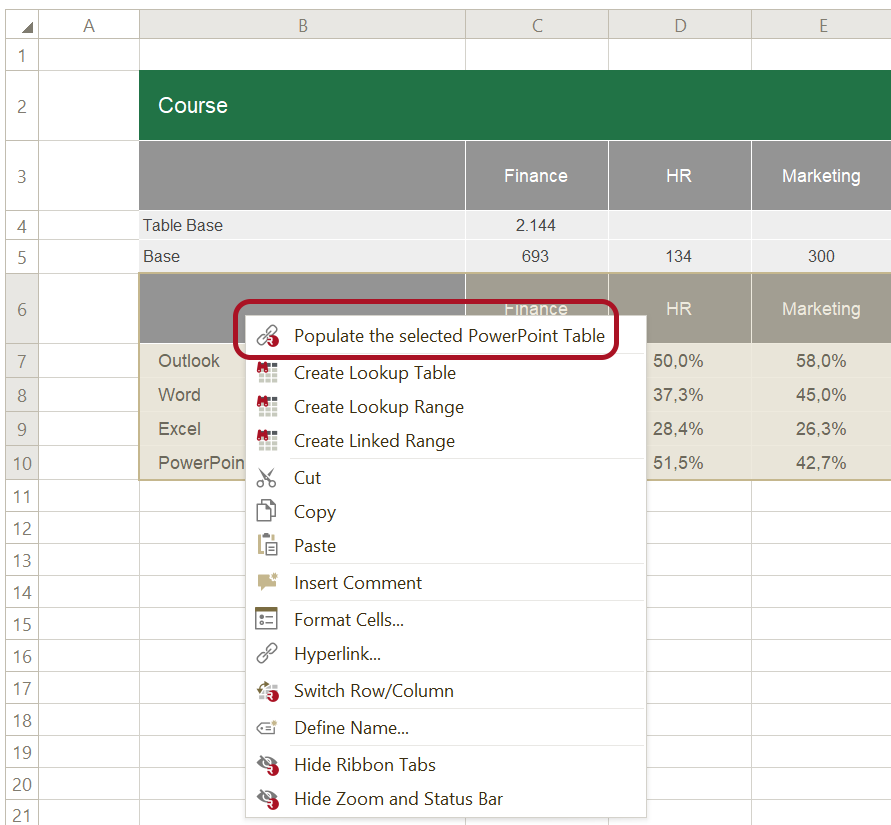
When you want to populate and link data to a PowerPoint Table, make sure you have selected the cell in the table where you want to start populating data. In the Workbook Pane, select the data range you need in the PowerPoint Table, right-click the mouse and choose 'Populate the selected Table'.
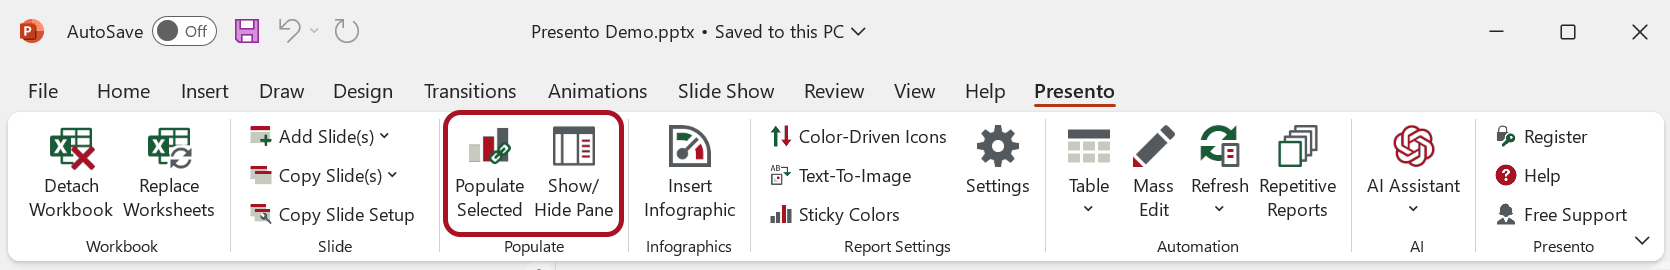
If the workbook is open in Excel, please click 'Populate Selected' in the ribbon tab in PowerPoint:
The Table will be 'linked' to the data range, so when the data in the range changes, we can update the PowerPoint Table (Refresh).
When you click a 'linked' PowerPoint Table, the 'Populated Pane' will appear on the right side. Here you can change the following 'Populate Settings':
Conditional Formatting
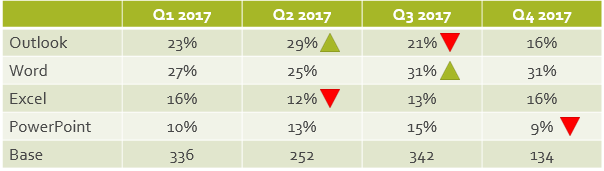
In case the range in the workbook contains fill/font colors, e.g. from conditional formatting or from a pairwise significance comparison, OfficeReports can visualize these colors either as Font and/or Fill color, or using icons in PowerPoint. Read more about 'Color-Driven Icons'.
Table settings
In the 'Properties' box you can find the settings to control how the Excel data is displayed in PowerPoint tables.
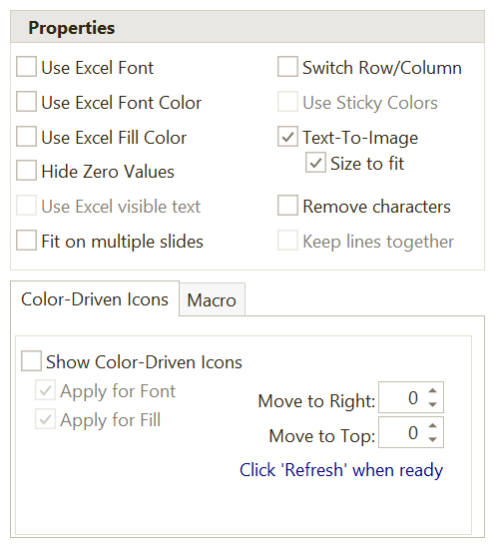
Most features speak for themselves. If you e.g. check 'Use Excel Fill Color', the fill colors of the cells in the table will match the fill colors of the cells in the linked Excel range.
When checking 'Text-To-Image', the image which is defined to replace a specific text will be shown. You define which images to use for a specific text in 'Text-To-Image' in the ribbon tab.
Remove characters will remove characters from numbers, so this is a way to get rid of significance characters.
Show Color-Driven Icons
OfficeReports can add icons to tables, depending on the fill color of the linked cells in Excel.
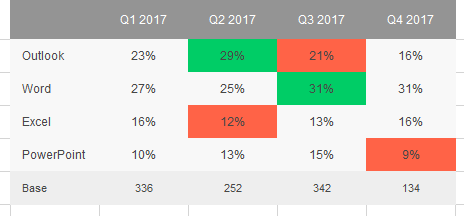
The fill colors in Excel above are displayed as shapes in the PowerPoint Table. Read more about Color-Driven Icons.
Dynamic Sizing
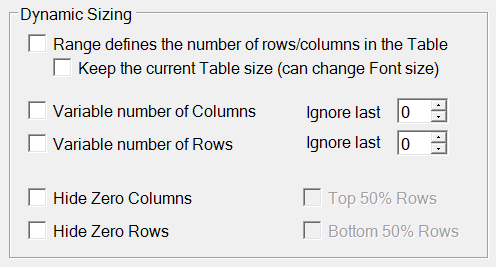
Building reports and presentations where the number of rows and columns in tables are variable often means a lot of manual work. OfficeReports adds 'Dynamic Sizing' features which automates a typical time-consuming manual process.
The following text describes the functionality in Dynamic Sizing. The recommended workflow might vary depending on the situation.
Range defines the number of rows/columns in the Table

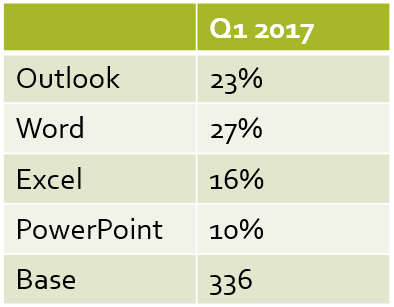
1. Add or select a table in PowerPoint. If a new table is added, the PowerPoint default size is 5 columns and 2 rows. Put the cursor in the cell in the upper left corner, if this is the starting point for adding data.
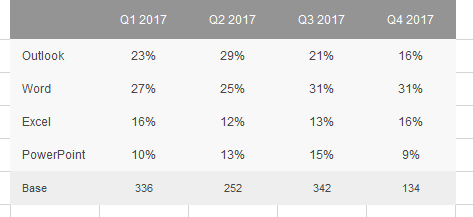
2. Select a data range in Excel (2 columns, 7 rows):

3. In the task pane, click 'Add Link to selected Table'.
4. Check ‘Range defines the number of rows/columns in the Table’. and we will get the table below.
Keep the current Table size
OfficeReports will keep the table size the same when changing the number of rows and columns. In some cases when adding rows/columns this might not be possible.
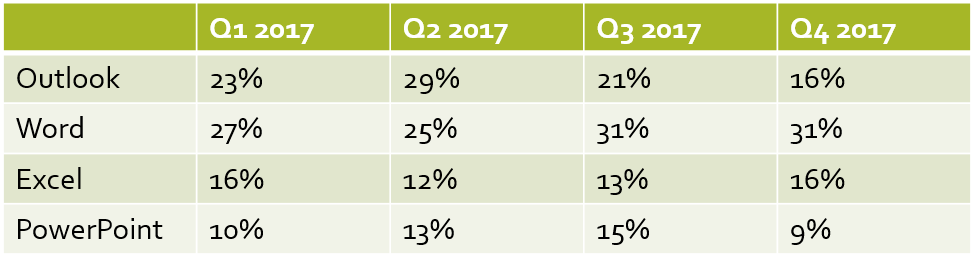
Variable number of Columns
Check ‘Variable number of Columns’. OfficeReports will check whether the columns to the right, next to the selected range contains data. If we find data, this feature will expand the PowerPoint table column wise:
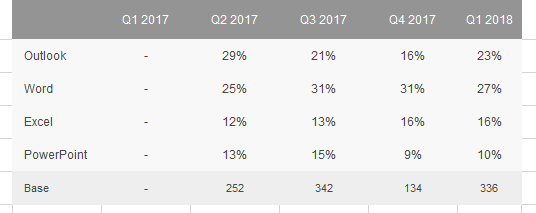
Variable number of Columns - Offset
When using a Dynamic Sizing, and a Variable number of Columns, OfficeReports will include all Columns until we meet the first empty column outside the selected data range. In some situations, the last 1, 2 or 3 columns are not wanted in the populated PowerPoint table. These can now be extracted by using the feature ‘Offset X Columns’ When defining ‘Offset 1’, OfficeReports will exclude the last column containing data. An example follows for ‘Variable number of Rows – Offset’, below.
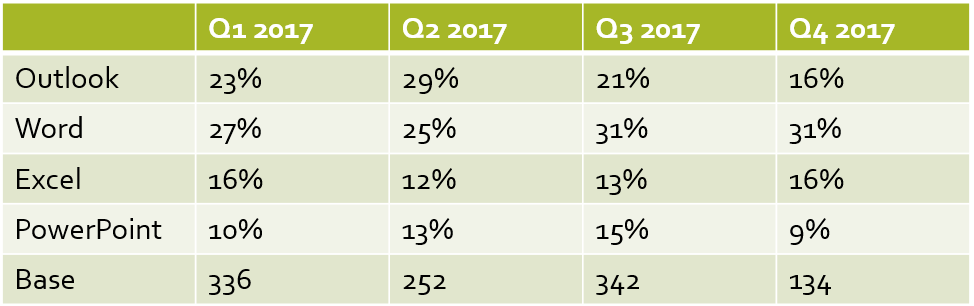
Variable number of Rows
Similar functionality as described for ‘Variable number of Columns’.
Variable number of Rows - Offset
The ‘Range defines the number of rows/columns in the Table’, but we would like to exclude the last row. Therefore we check ‘Variable number of Rows’ and ‘Offset’ = 1 row.
The result is a table where the last rows from the linked Excel range is removed.
Hide Zero Columns
In situations where the defined data range contains Columns with no data, Office Reports provides an option to hide these Columns in the populated PowerPoint table.
Check ‘Hide Zero Columns’ and you get the following result:
Hide Zero Rows
Similar functionality as described for ‘Hide Zero Columns’.
Advanced (Run Macro)
If there is a need for functionality that go beyond what is standard in OfficeReports, it is possible to define to run a specific VBA Macro anytime OfficeReports updates a link. This makes it possible to create any kind of table. Read more about VBA Macros. You need the Intelligo Premium or Presento Premium edition for using macros.