Easily select specific data ranges within an Excel Workbook and seamlessly apply them to native PowerPoint shapes, tables, and charts.

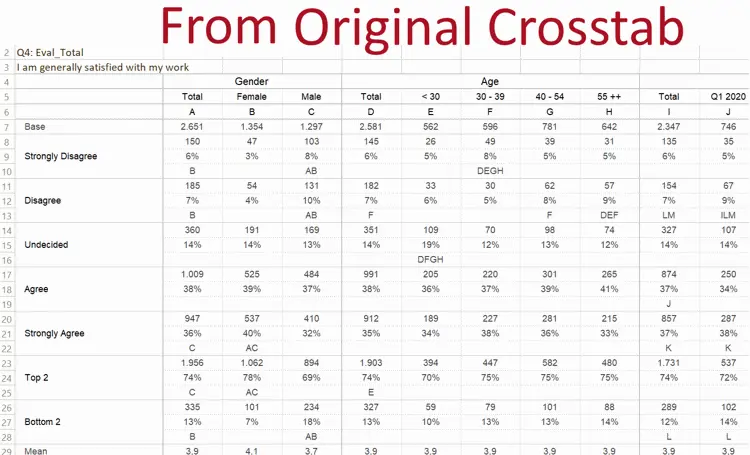
For scenarios where selecting the right range is complex, especially in crosstabs with counts, percentages, and significance details, OfficeReports introduces the advanced 'MR Lookup Table'. This feature efficiently extracts crucial data from crosstabs and allows for easy sorting, formatting, and customization to highlight the significance you need. This turns your static crosstab into a dynamic representation.

With OfficeReports, PowerPoint tables and charts can be populated while preserving the font and background colors of the chosen range. These colors also have the potential to serve as indicators, showcasing icons like arrows (and any other shapes) within PowerPoint.

Beyond this, OfficeReports facilitates text-to-image replacement and simplifies the utilization of chart types that are typically challenging to create in PowerPoint. Examples of such chart types include 'Quadrant Charts', 'Vertical Line Charts', and 'Diverging Bar Charts'.

Download Free Version

More OfficeReports Presento MR functionality:

  • Sticky Colors - Ensure consistent colors for specific series, even after sorting, enhancing data visualization clarity
  • Chart-axis texts in a table - Enable axis text formatting with OfficeReports, enhancing the presentation of chart data
  • Customizable infographics - Use sliders, conditional smileys, gauge charts a.o.
  • Efficiency - Utilize advanced copy functionality to efficiently reuse the work already done
  • Report Automation - OfficeReports offers flexible linking of ranges, adapting seamlessly even as your data grows


The resulting PowerPoint Presentation contains editable native PowerPoint Charts and Tables.


Testimonials

Joel M.
Joel M.
Research Manager
Market Research, 11-50 employees

"Offers a vital link between Excel and PowerPoint"

Great program, nothing quite like it. Once set up, this offers a vital link between Excel and PowerPoint that we've never had access to before. Works seamlessly once you get your head around the layout. Torben is a good point of contact too, really helpful when we were getting to grips with it.

Gary E.
CEO
Management Consulting, 1-10 employees

“Excellent software for tabulations and PowerPoint report building.”

We do frequent ad hoc analytical reports for various clients, in their PowerPoint templates. OfficeReports allows us create new presentations quickly and efficiently. The data tabulations, data tables, and the setup for our ad hoc reporting needs are exceptionally good.

Henrik K.
Henrik K.
CEO
Management Consulting, 1 - 10 employees

"Reducing time in report production"

Good experience both for analyzing and report production. Great to use templates for recurring reports and report automation.

Faheem S.
Faheem S.
Asst. Manager
Market Research, 1001 - 5000 employees

“An Innovative tool for Tracking Studies"

I have used this software for generating tracking studies for almost 3 years. There are multiple features which help to make things very efficient. The OfficeReports team is very supportive, they always come up with new ideas to resolve the problem, and never hesitate to add the necessary feature, very few software has that option. I would recommend this software for Report Automation.

Teymour A.
Principal
Market Research, 1-10 employees

“Powerful tool for integrated data processing and report generation”

It's a game changer for me: generates time savings, allows us to be nimble, offer quicker turnaround to our clients. The filtering of data to produce batch reports Seamless integration with PPT and Excel All-in-one from data processing - including cross-tabs - to reporting Technical support is outstanding - responsive, solution oriented.

Stuart H.
Data Scientist, Research

“Excellent ”

The software is so good at what it does and the support is equally good! The usability was excellent and intuitive. Everything worked extremely well, as designed.

Some of our happy customers

Experienced survey researchers that switch to OfficeReports are reporting five- to ten-fold time-savings when producing charts and tables, compared with using other tools.

Kantar
Sachs Media
AMG Research
Simpson Carpenter Insights
Ugam
Nepa
IWD Market Research
Nectar
Impaq International
Radius Global Market Research
Blackbox
mm customer strategy
UFC
7th Sense Research UK Ltd.
Geo Strategy Partners
Kuulas Helsinki
prolytics market research GmbH
Consensus Point
Isobar
Seurat Group
Skopos Group
Course5