Tables, Charts and Shapes
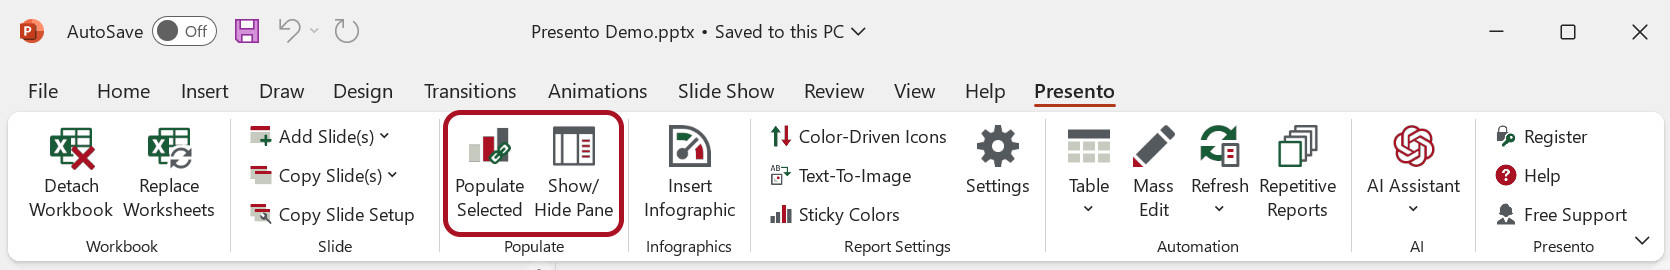
You can populate native PowerPoint tables, charts and shapes with a data-range from the workbook. Select the shape, table or chart on the slide, select a range of data in the worksheet and right-click in the selected range and choose 'Populate the selected...'. Alternatively, click the 'Populate Selected' icon in the ribbon tab.
Afterwards, the 'Populate Pane' appears in the right side of the PowerPoint application. Here you can set how you want to display the linked data. Please get more details here: Populate Charts, Populate Tables and Populate Shapes