Weighting
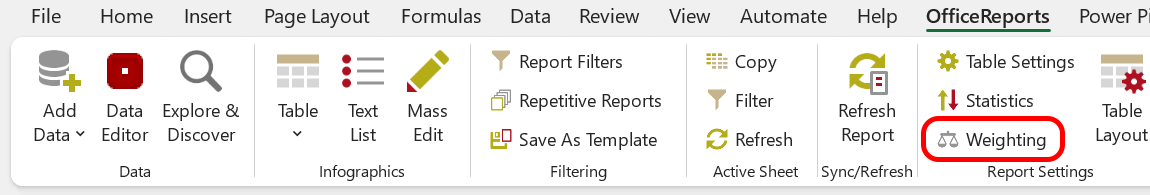
We use weighting (balancing) to correct disproportional sample sizes and adjust the collected data to represent the population from which the sample was drawn. For example, we can see that the proportion of Males in our sample is 65%, while the proportion of Males in this particular population is 55%. This means that our sample is not representative, i.e. the frequency distribution of our sample does not match that of the population and estimates for that group may be biased.
OfficeReports can use weights for all cases to adjust this distortion within a sample in all table and chart calculations. If weights are not imported with the data set as a numeric variable, OfficeReports can calculate the weight variable using RIM-weighting over multiple dimensions.
Calculating case weights
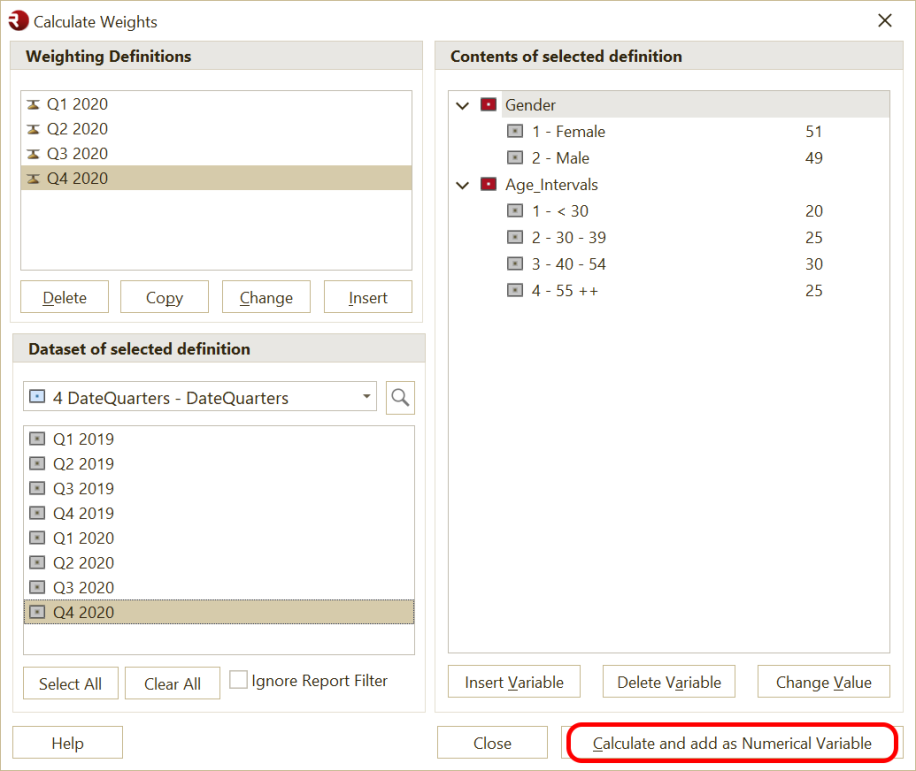
To create a weight variable please do the following:
1. Click 'Insert' and give the Weight definition a name.
2. Insert the variables you want to use for the weighting, e.g. gender and age. You can choose as many variables as you want.
3. Assign the correct values to the categories.
4. Specify the sample you want to weight, e.g. Q1 2020.
5. Click 'Calculate and add as Numeric Variable'. This will create a new numeric variable in the Data Editor containing the calculated weights for each respondent.
In the Data Editor, you can merge multiple numerical 'weight' variables into a single variable by selecting the variables, right-click and choose 'Create SUM variable', and then use this variable as the Weight Variable for your tables and charts.
Default Weight Variable
If we have to apply weighting to all tables in a report, please choose a numeric variable and set it as the 'Default Weight Variable' in the 'Table Settings' Window.