Define Statistics Properties
Quite often a data set does not cover an entire population, but is just a sample of the population. If the sample is small, there might be considerable uncertainty in applying the measured results from the sample to the population. OfficeReports provides a number of statistical tests for tables and charts. These can be used to show whether differences in the distribution of counts in tables are statistically significant or whether they are merely due to chance.
Clicking 'Statistics' will pop-up the following window:

Here a short explanation for the different settings:
Confidence levels for T-Test and Z-Test
You can select the confidence level that you require for the Z-Test (column proportions) and T-Test (column means). The default setting is 95%, but your options are from 99% down to 50%. By default, OfficeReports will display the difference with uppercase characters for the first 26 columns, lowercase characters for the next 26 columns ( in case the second confidence level is not used) and special characters up to column 96.
Optionally, a Confidence level 2 can be added in the test. The test level must be lower than Confidence level 1. OfficeReports will display the difference with lowercase characters. This means that we in one table can include both a significance test on e.g. a 95% and one a 90% level of confidence.
Read more about specifying which columns to test and how to visualize significant difference.
Minimum Base & Low Base
You can define that the significance test requires a minimum number of observations. Office Report suggest a minimum base of 30. In case you define a 'minimum base' character, this character will be added to the numbers in the table or chart in case the base is below the specified minimum. The same goes for the 'low base'.
Observe: The notification is based on the unweighted base.
Always show base notifications
By default, OfficeReports shows Minimum Base and Low Base only in case significance testing is applied. Check the ‘Always show base notifications’ box to if you always want to see the base notifications.
T-Test (Column Mean Test)
This test looks at means that are presented in a row of a table and compares pairs of columns, testing whether the mean in one column is significantly different from the mean in the other column.
By default, OfficeReports is using the Student’s T-Test, compensating for overlap. Alternatively, OfficeReports can use Welch’s T-Test. The Welch test does not assume equal variances and computes the degrees of freedom empirically using a function of the group sizes and the variances.
Z-Test (Column Proportions Test)
This test looks at the rows of a table independently and compares pairs of columns, testing whether the proportion of respondents in one column is significantly different from the proportion in the other column. The proportion is the count in the cell divided by the base of the column.
Effective Base
In situations where results are weighted, OfficeReports by default uses the Effective Base rather than the simple weighted base in statistical tests on weighted tables. This option has no effect on statistical tests run on unweighted tables.
The effective base is designed to reduce the likelihood of the statistical tests producing significant results because of the adjustments made by weighting; the effective base takes these adjustments into account.
Confidence Interval
The setting of the Confidence Level defines how secure we want to be to be to express a statistical test result. When we for example claim that a certain difference of percentages or means is significant, or that a certain result 11% has a confidence interval at +/- 1,1 this does not mean that we can be 100% sure of this result, but we can be sure on a certain level.
Setting the Confidence level is set at 95% (most commonly used level in market research) this is an indication that we can be 95% sure that the result is significant or that we can be 95% sure that the true result in the population is within 9,9 -12,1%.
When adding confidence intervals to a table, OfficeReports by default assume that the sample represents a large population and the sample represents less than 10% of the population. If the sample represents a significant proportion of the population (> 10%) we can enter the Population Size in order to adjust the test formula.
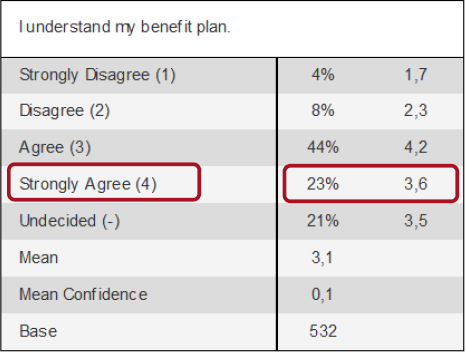
Confidence Intervals can only be added to frequency tables, where an extra column will displaying the confidence level, while an extra row will show the 'mean confidence interval' in case the table contains a 'mean' row:
Chi-Square test
Chi-Square tests can be used in cross tables. The chi-square test looks at the variables on the side and top axes of a table and tests whether they are independent. For example, it can be used to show whether variations of a rating depend on gender:
