All the Report Settings
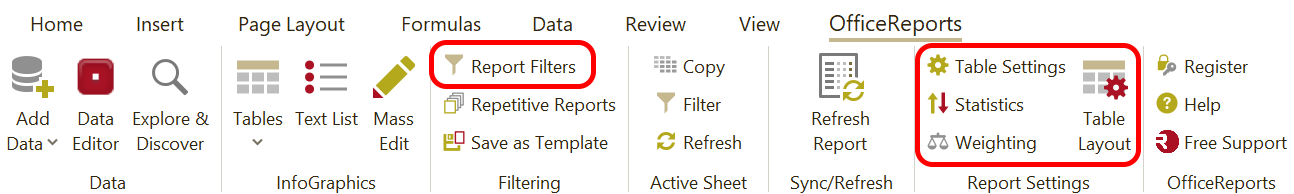
Before starting to create tables you should set all the report settings you need, and OfficeReports has quite a lot of them. Having defined the default settings you need, you will save a huge amount of time creating tables. Here an overview of the default settings you can define:
Table Layout
In the table Layout you control:
• The number of decimals shown for percentages and mean values (which can be overruled for any table)
• Whether the ‘Total’ and the ‘Mean’ are shown in the first row/column
• Whether the percentage character is shown.
• Whether the final results in Excel are rounded (so the value equals the formatting)
For all options have a look at the Table Layout options.
Variables
In the Variable window you can set 'defaults table settings' for often used variables, like:
• Default significance test
• Sorting
• Minimum base for the categories of this variable (otherwise the category is not shown)
Read more about the 'Default Table Settings'.
General Settings
In the Table Settings window, you must set some other defaults:
• The weight variable
• Zero-base text (e.g. ‘N/A’)
• Ordinal Variables and their default statistics. This way you control whether a table default contains a ‘mean’ and or a ‘total’ row/column.
Read more here.
Report Filters
If your data set e.g. contains previous periods (to enable comparing to previous periods), you might have to set the Report Filter to the current period. Read more about Filtering.