The Lookup Table
In those cases where you do not want to report all the content from a specific range or if you need to combine the results from different ranges or if you need to sort or transpose an original range you can use Linked Tables. Linked Tables contain cells linked to 'original cells', just like you can do in Excel by entering a formula like '=A1' in a cell. Doing this in Excel will result in Excel just displaying the value of cell A1. In an OfficeReports Linked Table, also the 'original' formatting, font and fill color are used. Besides that, Linked Tables can be sorted and if the original table contains significance info, you can define a pairwise significance comparison!
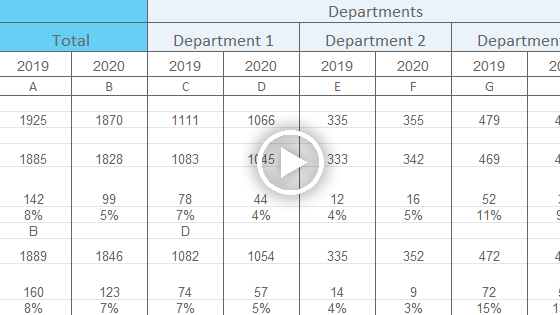
Especially when having to report already aggregated data containing both count and percentage and significance info, you will need a Linked Table since you definitely do not want to report both count and percentage in a single chart.
In order to create a Linked Table, you have to select all the rows and columns you need from a specific range. OfficeReports will automatically include all cells part of both the selected rows and the selected columns. When reporting standard cross-tabs from other products, you might have to select the 'count' row because it contains the answer alternative text in the stub. No problem: OfficeReports will combine the right values from the different rows and create a table containing a single row containing the answer alternative text, the percentages and visualize the significance using the fill color. The Linked Table can then be used to populate a chart or a table. Please have a look at this video showing you how to do it:
Report Automation: Mass Creation of Linked Tables
Instead of creating all Linked Tables manually, we recommend you create a worksheet containing the 'flexible' definition of the Linked Tables. You will need a 'Presento Premium' or 'Intelligo Premium' license to do this. These definitions are flexible because the data for the next wave does NOT need to be in the same place. As long as the 'identifier' is unique, OfficeReports will be able to find the original table, update the Linked Table and update the presentation. This is Report Automation.
For each Linked Table, OfficeReports needs to know where the table starts ('identifier') and what it should contain ('banner' and optionally 'stub'). This can be done by creating a separate workbook with a first worksheet containing the columns described below, or (the easy method) by selecting the specific parts of the table we need and right-clicking and choosing 'Add to Table Definitions'. This will create a new worksheet 'Table Definitions' in the current workbook and fill out the right columns.
When done creating the Table Definitions, you can mass create linked tables (as shown in the video) by clicking 'Mass Create'. In case you did not create the 'Table Definitions' worksheet you must choose an Excel workbook containing the Linked Table definitions using the columns described below in the first worksheet.
o specify the 'stub', 'significance', 'row-sort by', 'row sort type', 'col-sort by', 'col-sort type', 'do not sort', 'statistics', 'format manual', 'percent decimals', 'number decimals', and 'destination'
Identifier
The identifier can be any text which uniquely identifies a specific table. OfficeReports finds the table which contains the content we want in the linked table by searching for the 'identifier' text in the first 4 columns of all worksheets.
Banner
You can specify the banner (table columns) by either a semicolon separated text containing the banner categories or by the name of an Excel Named Range which contains the text of the banner categories (exact match!). OfficeReports will search for the specified texts from the row where the identifier text was found until 10 rows after. When the banner row is found, OfficeReports will look in the next 3 rows for a row containing significance characters for each column. All texts in such a row should either all have a single character, all have 2 characters or all have a single character in parentheses. (Or be blank).
The linked table will contain the banner categories in the order specified. You do not have to specify them in the same order as displayed in the aggregate table!
Important: In case your aggregate tables contain multiple variables and a total for each variable, it is important the total is displayed before the categories of the variable in the aggregate table!
Stub
You can specify the stub (table rows) by either a semicolon separated text containing the stub categories or by the name of an Excel Named Range which contains the text of the stub categories (exact match!). OfficeReports will search for the specified texts from the row after the banner row, or after the row significance characters were found.
Specifying the stub is optional. If you do specify the stub, OfficeReports will add all items found until it runs into 3 empty cells in the column, which indicates the end of the table. Alternatively you can specify how all tables end by naming a cell 'EndOfTable'. When OfficeReports reads a cell with a text that starts with the text specified in named range 'EndOfTable', the end of the table is reached.
Statistics
In case you have not specified a stub, OfficeReports will automatically add rows like 'Total', 'Base', 'Mean' etc. to the stub. Specify 'Y' if you want to see these rows in the Linked Table.
Significance (optional)
In case your tables contain significance information in such a way that OfficeReports could find a row defining which character(s) belong to a certain column (see Banner), then it will be possible to specify what kind of 'pairwise' test OfficeReports should display in the linked table:
'first' - compare all columns to the first column
'next' - compare each column to the next column
'previous' - compare each column to the previous column
'AB' - compare all columns 2 by 2 (AB;CD;EF etc.) and display the result in the first column of each pair
'BA' - compare all columns 2 by 2 (BA;DC;FE etc.) and display the result in the second column of each pair
custom definition: just specify a pairwise list of the columns you want to compare to each other. The result will be displayed in the first mentioned column of each pair. So if you want to compare all columns to the previous column, but you do not want to compare to the first column (maybe a total), you specify "CB;DC;DE;FE;GF";
Destination
Specify the worksheet name where you want the specific table created. If the sheet does not yet exist, it will be created. In case multiple tables are added to the same sheet, the next table is added in the bottom of the sheet.
It is a good practice to add tables you need for the same slide on the same worksheet, and call the sheet e.g. 'Slide6'.
'Row-Sort By' and 'Col-Sort By'
OfficeReports will sort on the row/column where the banner/stub text starts with the text specified.
'Row-Sort Type' and 'Col-Sort Type'
Specify 'asc' for sorting ascending sort and 'desc' for sorting descending.
'Percent decimals' and 'Number decimals'
In case the original table is not showing the numbers the way you need to show them in the presentation, specify the number of decimals you need.
See also:
- Visualizing Significance
- Populating Tables, Charts and Shapes