The Help Pane
Use the OfficeReports Help Pane to help you learning how to use OfficeReports. By keeping the pane visible and the 'Context Sensitive' box checked, the pane will always provide help for your current situation. Use the search box if you are looking for help on a specific topic.
Get Started
This presentation is neither linked to a workbook nor has it any imported data. This means you have the following 2 options now:
Working with survey data (raw data)
You have the raw data in either SPSS, Excel, Triple-S or CSV format, or you want to connect to your SurveyMonkey or Alchemer account and report a specific survey. If the 'Import Data' window is still visible, please click the correct option. Otherwise, please click the 'Import' button int the OfficeReports ribbon tab and choose the correct option. Below you can see a video where we import a SPSS data file:

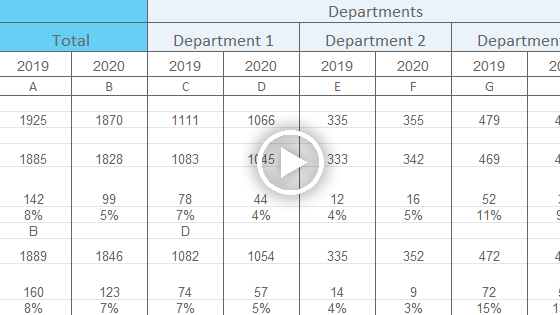
Working with crosstabs (aggregate data)
You do not have the survey data, but you received crosstabs and other tables containing the information you have to report in PowerPoint. Please attach this workbook to the presentation by clicking 'Attach Excel Workbook' either in the 'Import' window or in the 'Import' menu in the OfficeReports ribbon. Below you can see a short video on how it is done: