OfficeReports Intelligo offers a potent crosstabulation engine accessible within both PowerPoint and Excel. In both instances, the crosstabs are constructed within a workbook, granting you full access to Microsoft Excel's range of functionalities.
If you're working with pre-aggregated data (crosstabs), consider exploring our Presento MR solution.
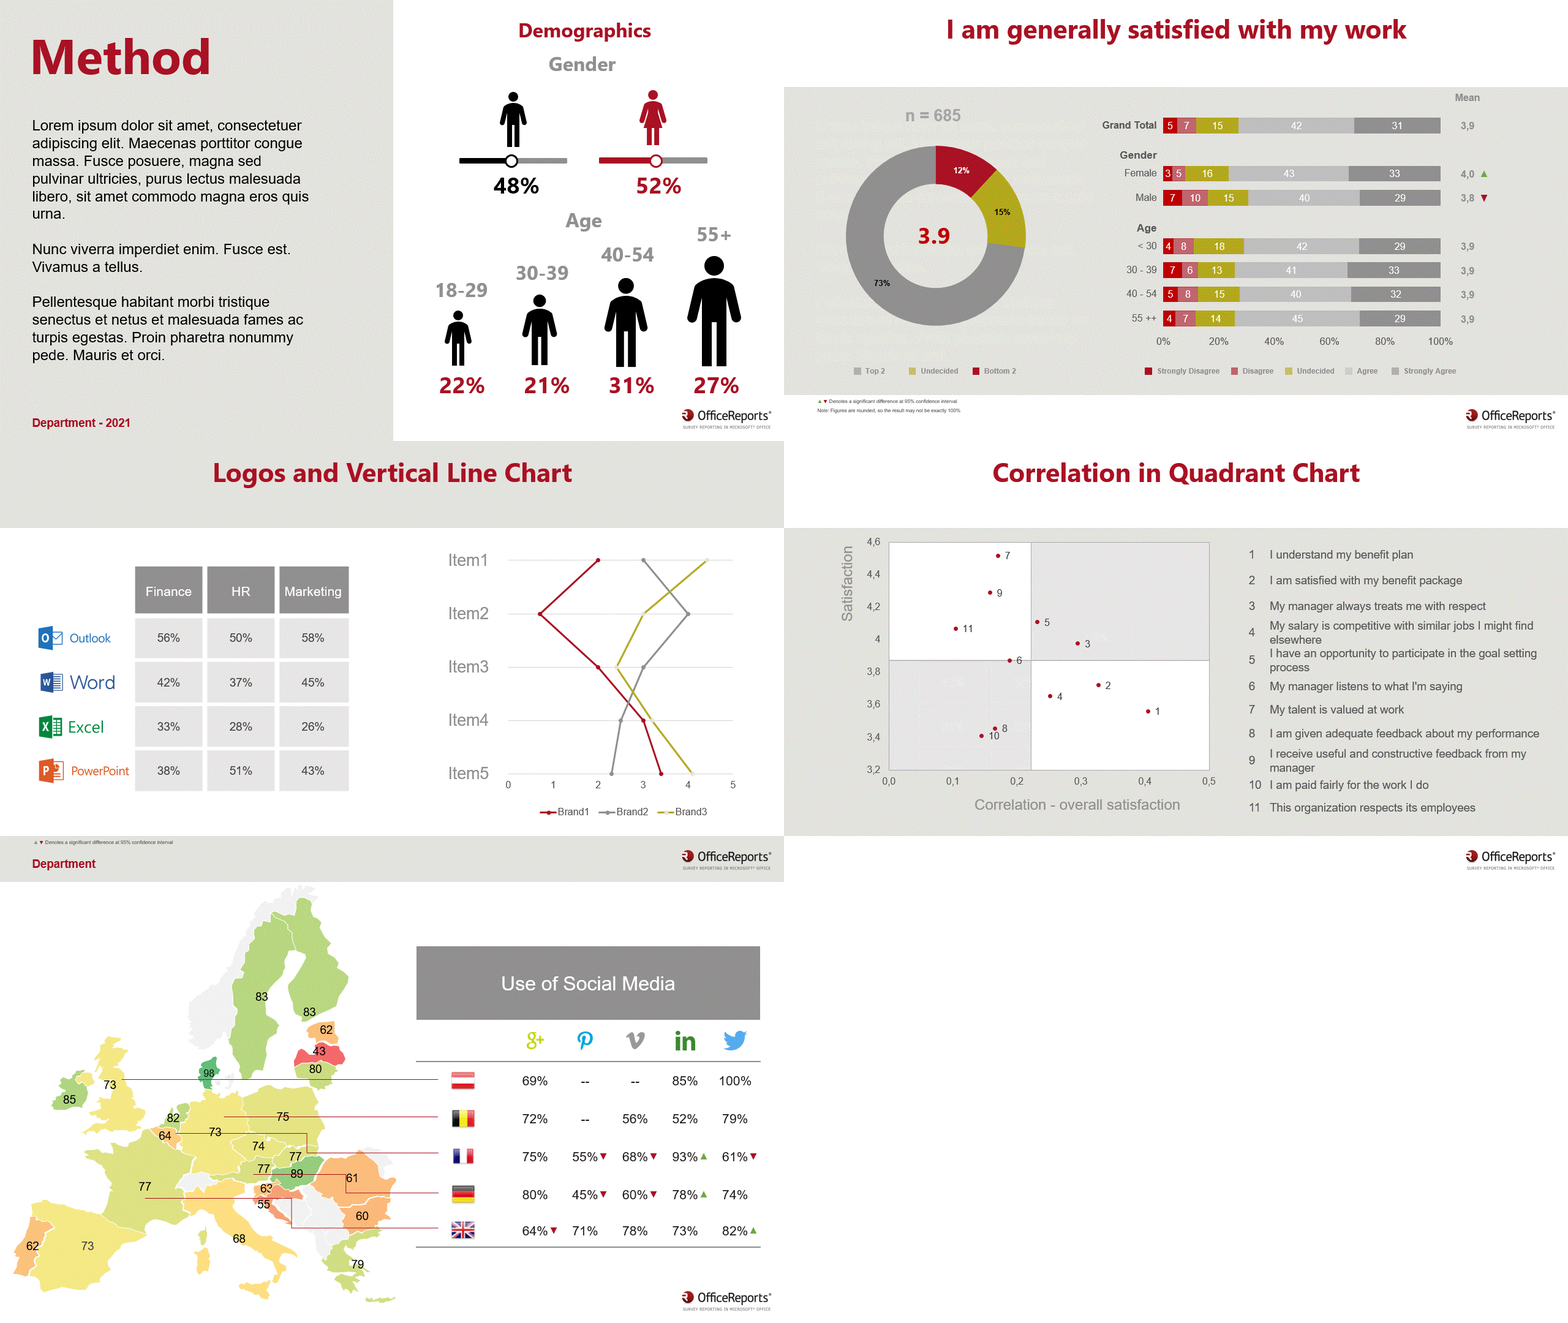
Our Intelligo solution seamlessly integrates a workbook into PowerPoint through the 'Workbook Pane', enabling effortless visualization of results in PowerPoint tables, charts, and Shapes. This integration eliminates the need for manual transitions between these commonly utilized programs for data analysis and reporting, expediting the process of gaining insights from your data.
Should your final delivery not require a PowerPoint presentation and you solely need crosstabs in an Excel workbook, we offer our Calculo solution.


