Significance, weighting and correlation
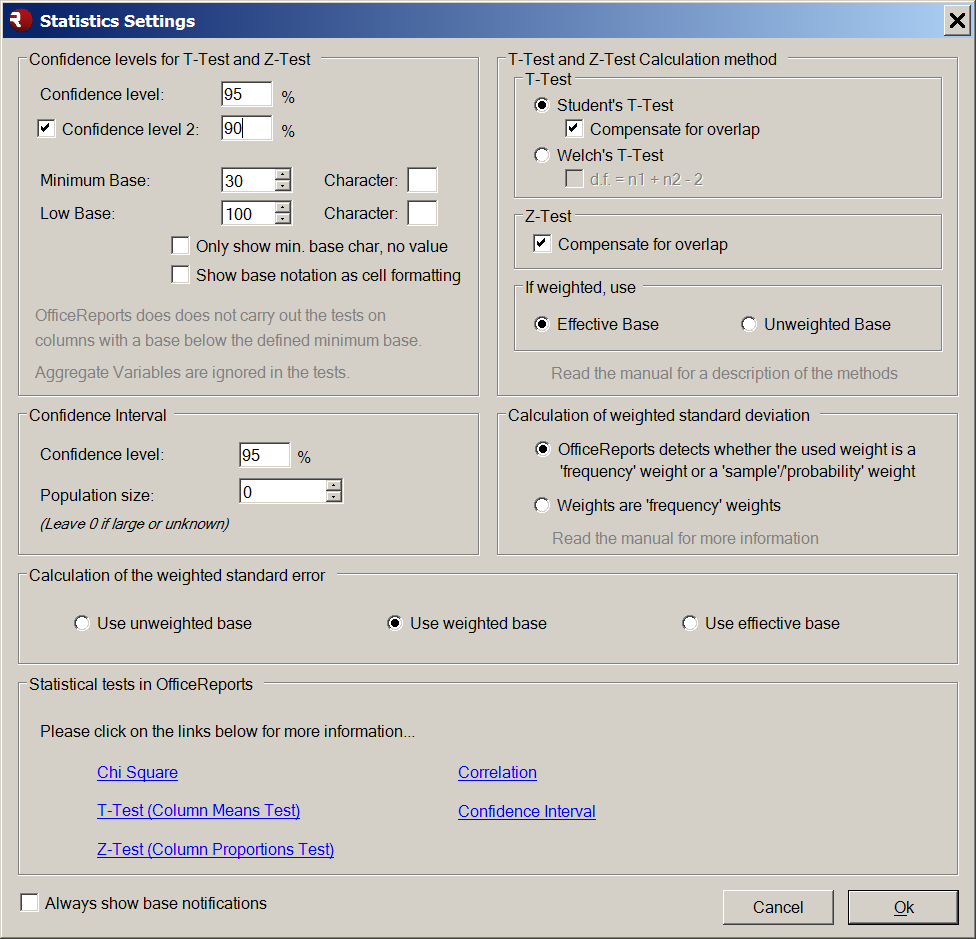
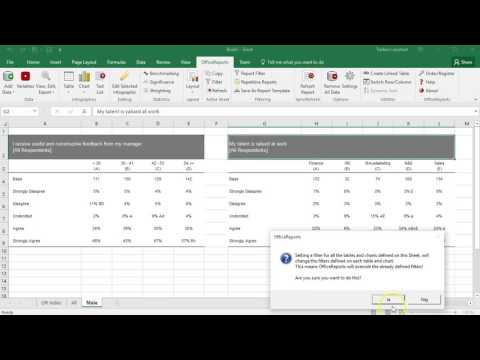
Significance calculation and visualization is quite important for reporting most surveys. OfficeReports has functionality for Z-Test and T-Test (Student and Welch) with options for using effective base or unweighted base and compensation for overlap. You can define which columns you want to compare, and in case you compare pairwise, OfficeReports can visualize significance changing the cell background color, instead of adding significance characters. This is very important when we want to visualize significance using arrows in PowerPoint. Besides being able to calculate significance for 2 defined levels at the same time, OfficeReports can also add characters for 'low base' and 'insufficient base'.
Besides significance calculation, OfficeReports can weight the data behind the tables and charts. You can either specify you want to use an (imported) numerical variable for the weighting, or you can create a 'weight variable'. When using OfficeReports to create the weight variable, you can specify weight values for multiple dimensions, and OfficeReports will use the RIM weighting algorithm to calculate the weight for each respondent.
The last statistics feature we want to mention is correlation. When defining a 'grid' table, it is possible to show the Pearson correlation, including significance.