The Data Editor

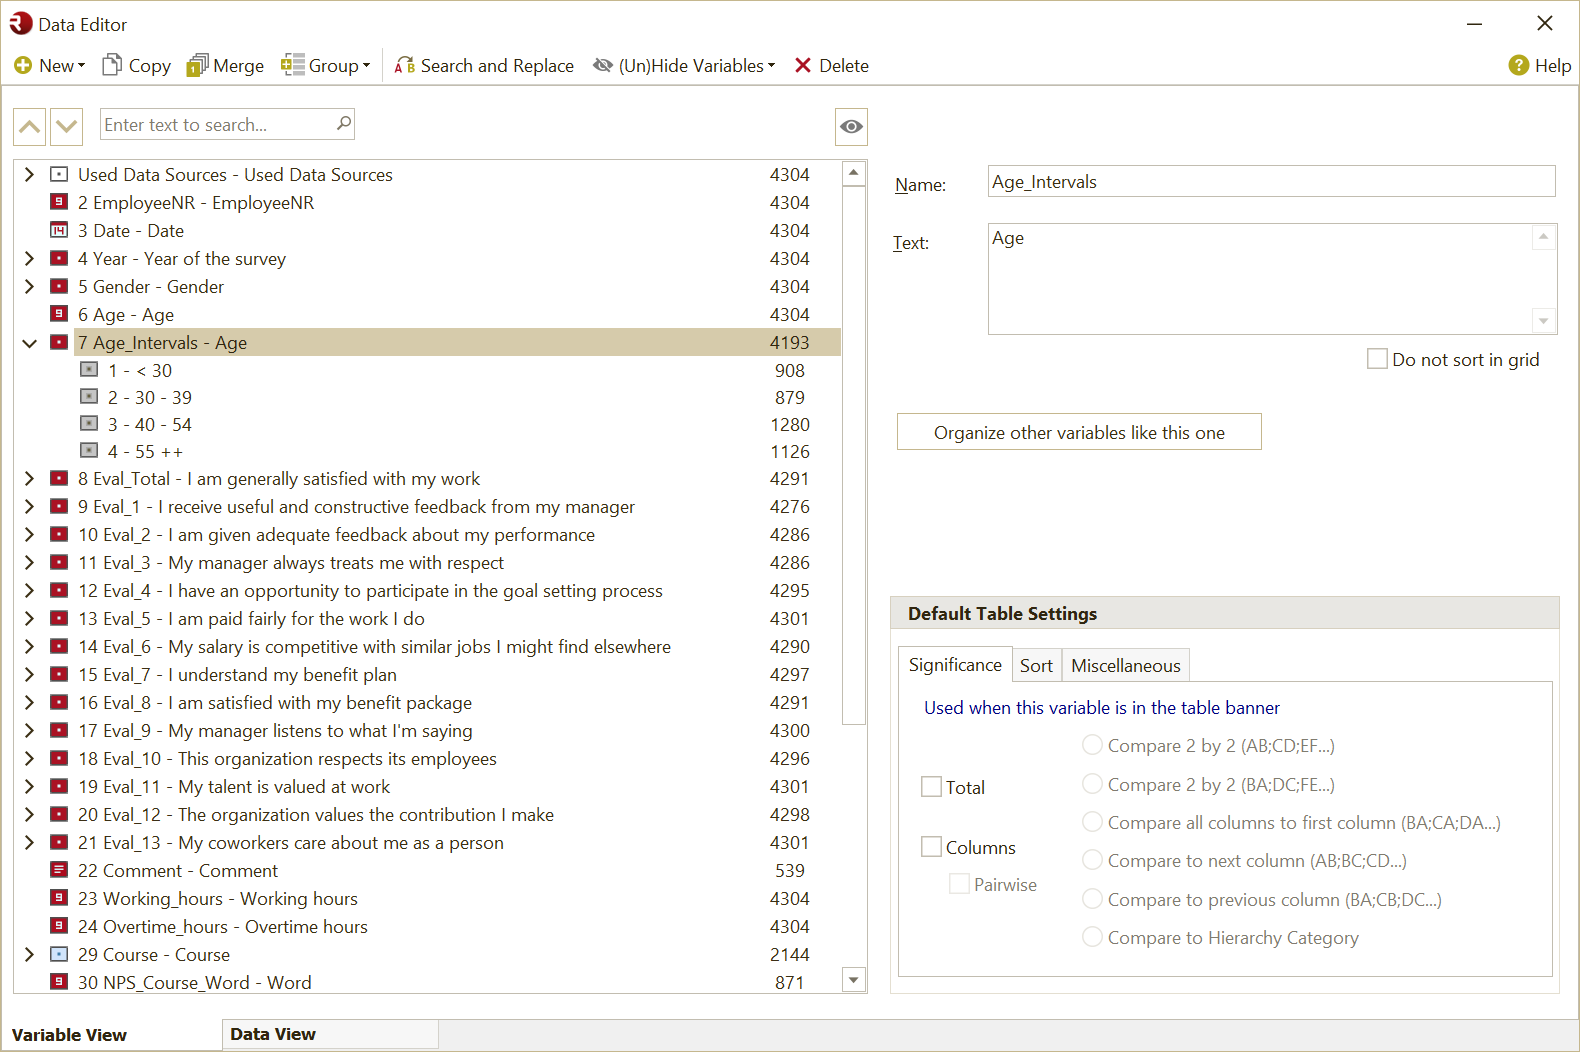
Just like in SPSS, our Data Editor consists of a Variable View and a Data View. However, our user interface is much more up-to-date and easy to navigate, containing smart functionality for fast recoding of the variables, without the need of syntax files. OfficeReports will merge and group of variables and categories, create periods from dates and intervals from numeric variables - automatically. You can create new variables manually as well and use our formula editor to create what you need.

By selecting just a few variables in the Variable View, the Data View will only show the selected variables. This is extremely helpful when you need to check to see if your re-codes are correct.


Creating Cross-Tabs

OfficeReports has a whole host of features to make fast table creation possible. By setting the right report setting and the right 'table default settings' for specific variables, you can enable OfficeReports to create the right tables immediately, without needing to change settings. Combined with functionality like 'Insert Many Tables' and 'Create Crosstab Report' you are able to create large reports in minutes.

Tables are created directly in Excel, and can be edited using our 'Table Pane', which contains all the properties of the table.

You can define your own layouts so tables look the way you want.


Testimonials

Joel M.
Joel M.
Research Manager
Market Research, 11-50 employees

"Offers a vital link between Excel and PowerPoint"

Great program, nothing quite like it. Once set up, this offers a vital link between Excel and PowerPoint that we've never had access to before. Works seamlessly once you get your head around the layout. Torben is a good point of contact too, really helpful when we were getting to grips with it.

Gary E.
CEO
Management Consulting, 1-10 employees

“Excellent software for tabulations and PowerPoint report building.”

We do frequent ad hoc analytical reports for various clients, in their PowerPoint templates. OfficeReports allows us create new presentations quickly and efficiently. The data tabulations, data tables, and the setup for our ad hoc reporting needs are exceptionally good.

Henrik K.
Henrik K.
CEO
Management Consulting, 1 - 10 employees

"Reducing time in report production"

Good experience both for analyzing and report production. Great to use templates for recurring reports and report automation.

Faheem S.
Faheem S.
Asst. Manager
Market Research, 1001 - 5000 employees

“An Innovative tool for Tracking Studies"

I have used this software for generating tracking studies for almost 3 years. There are multiple features which help to make things very efficient. The OfficeReports team is very supportive, they always come up with new ideas to resolve the problem, and never hesitate to add the necessary feature, very few software has that option. I would recommend this software for Report Automation.

Teymour A.
Principal
Market Research, 1-10 employees

“Powerful tool for integrated data processing and report generation”

It's a game changer for me: generates time savings, allows us to be nimble, offer quicker turnaround to our clients. The filtering of data to produce batch reports Seamless integration with PPT and Excel All-in-one from data processing - including cross-tabs - to reporting Technical support is outstanding - responsive, solution oriented.

Stuart H.
Data Scientist, Research

“Excellent ”

The software is so good at what it does and the support is equally good! The usability was excellent and intuitive. Everything worked extremely well, as designed.

Some of our happy customers

Kantar
Sachs Media
AMG Research
Simpson Carpenter Insights
Ugam
Nepa
IWD Market Research
Nectar
Impaq International
Radius Global Market Research
Blackbox
mm customer strategy
UFC
7th Sense Research UK Ltd.
Geo Strategy Partners
Kuulas Helsinki
prolytics market research GmbH
Consensus Point
Isobar
Seurat Group
Skopos Group
Course5