Reorganizing crosstabs in Excel workbooks
OfficeReports introduces a few new concepts to reorganize already aggregated data. You e.g. want to populate a chart with percentages, but your crosstab also contains counts. Or you are automating a monthly report production, but the data you need is not always in exactly the same range. Or you want to combine specific ranges in different places to a single area range. When using Excel formulas, you loose the original formatting and you only get the value.
To solve these problems, OfficeReports introduces the "Lookup Table", the "Lookup Range" and the "Linked Range". All three of them will create a new range where each cell contains a formula referring to an 'original' cell.
The Lookup Table
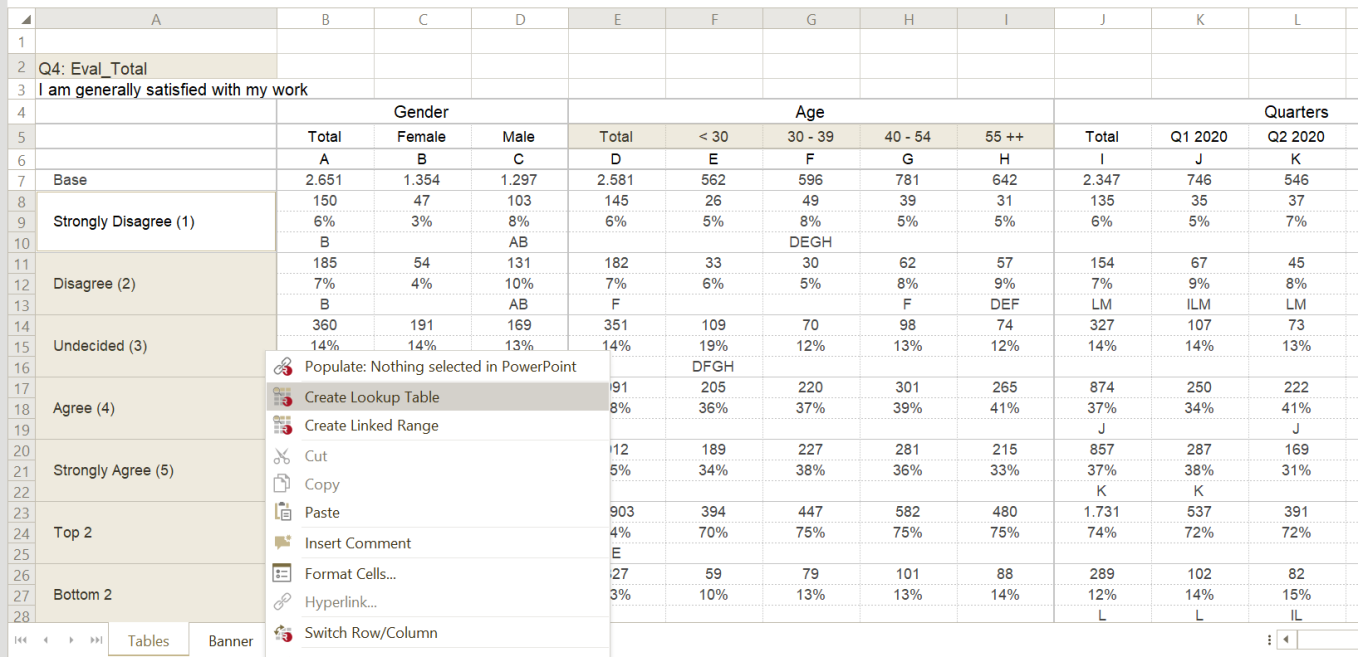
Turn standard crosstabs containing e.g. count, percentage and significance characters into more easy to handle tables using Lookup Tables. Select the cell containing e.g. a unique table name ('identifier' - must be unique on the worksheet), the cells containing the banner you want and the cells containing the stub. Right-click and select 'Create Lookup Table':
Then, click the cell where you want to create the Lookup Table. You can format and sort Lookup Tables, and you can show significant difference as read from the original table:
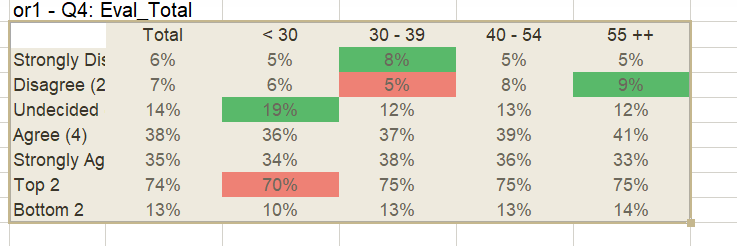
The result can easily be used to populate a table or a chart in PowerPoint and show significant difference using e.g. arrows.
The Lookup Table is a 'Search' function. OfficeReports looks for the defined texts and creates the table. This means that the Lookup Table still can be updated, even if the original table is moved somewhere else in an updated workbook (wave). This makes the Lookup Table very suitable for Report Automation.
You can double-click the Lookup Table and edit it. The Banner and stub will show in the defined order. You can edit the texts, or you can right-click the texts and reverse the order of the banner or stub.
The Lookup Range
The Lookup Range is similar to the Lookup Table, but instead of a banner and a stub, you define where the range is positioned compared to the 'identifier'.
The Linked Range
The Linked Range links cells directly to other cells, and also shows the font, font color, and fill color besides the value of the original cell. Using a Linked Range you can build a table from different ranges in other tables.