The Filtering options
OfficeReports Filtering System makes it possible to automate even very complex survey reports. Using OfficeReports it is possible to define multiple filters on different levels: the report level, the category level (table column) and the table level . Besides settings these filters, they can be ignored as well on the other levels.
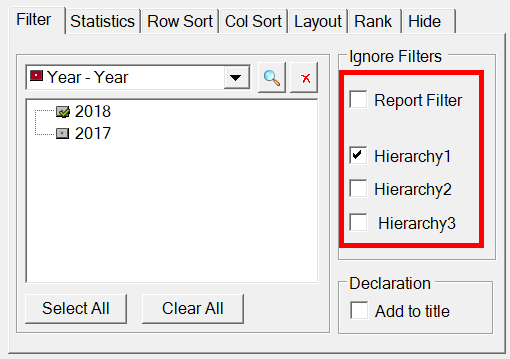
By clicking 'Report Filters' on the OfficeReports ribbon tab you define a Report Filter, and the filters Hierarchy1, Hierarchy2 and Hierarchy3. These filters can, each individually, be ignored at both the category (table column) and the table level. Have a look at the pictures below.
In the Variable window, select a category (of a derived variable!) and you have the following options:
The expression "[Department.Finance]" is some kind of filter itself, and we can define we want to ignore e.g. the Hierarchy1 filter.
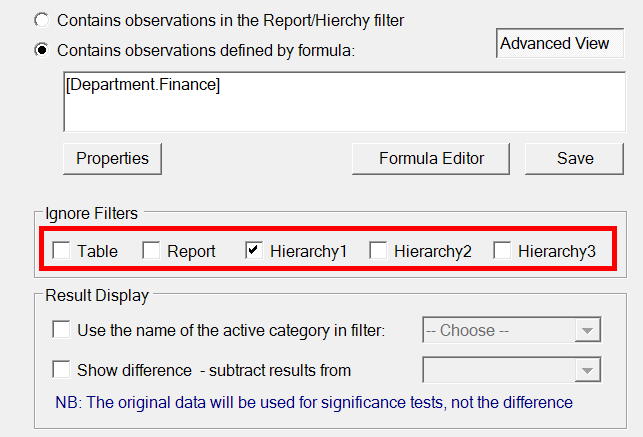
At the table level we have the following options:
An Example
The scene: We are creating reports for each Team in every Department and we want to create a table which shows all the teams of the department a team belongs to. We also want to add columns containing the results of the whole company, of the whole department and of last year. We want to show significance difference compare to the active team.
To achieve this, we set the Report Filter is to category "2020" of variable Year. We select department 'Finance' as Hierarchy1 Filter and team 'BKP' as Hierarchy2 Filter. Since we want to test significance against the active team, we have to use the banner variable we are creating as the Hierarchy2 variable and choose team 'BKP' from this variable.
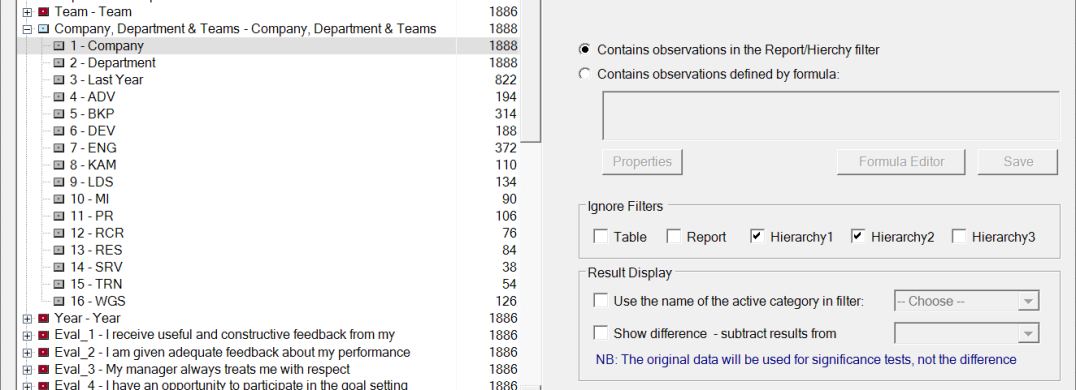
We create the banner variable we want to use in our tables by making a copy of the Teams variable and add the Categories 'Company', 'Department' and 'Last Year'. To get the numbers for the Company, we have to ignore the filters for the department and the team. The get the results for the complete department we have to ignore the team filter. See the pictures below:
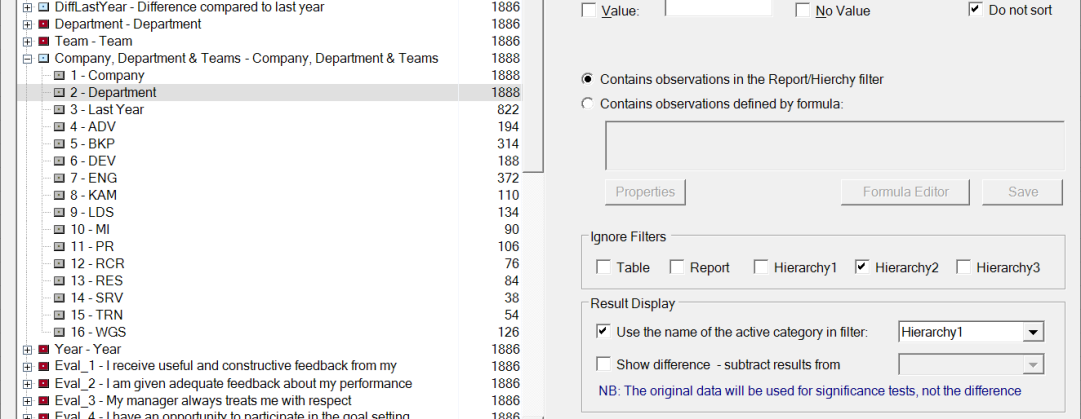
We want the name of the 'active' department to show in the table, so we check 'Use the name of the active category in filter Hierarchy1'.
To get the results of Last Year, we need [Year.2019] as formula. If possible, use the Formula Editor to create formulas. In this case we need to ignore the Report Filter, otherwise this column will not contain any data:
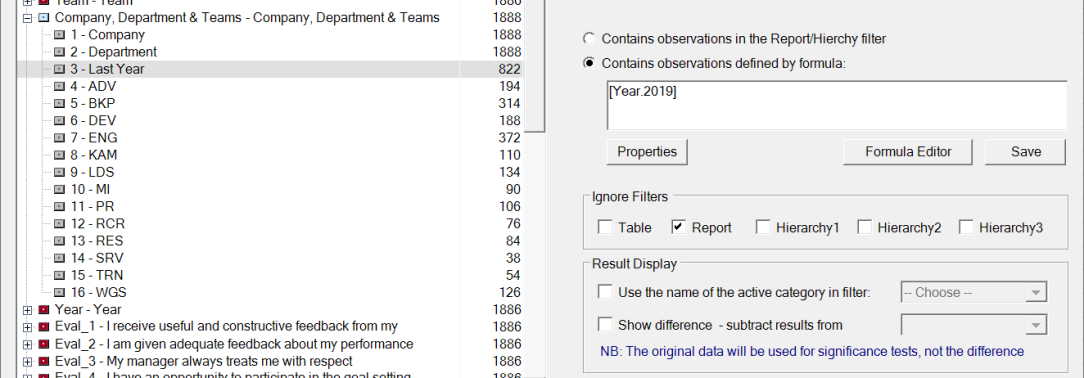
If we also check 'Ignore Hierarchy2' we would get the results of last year for the department instead of the team.
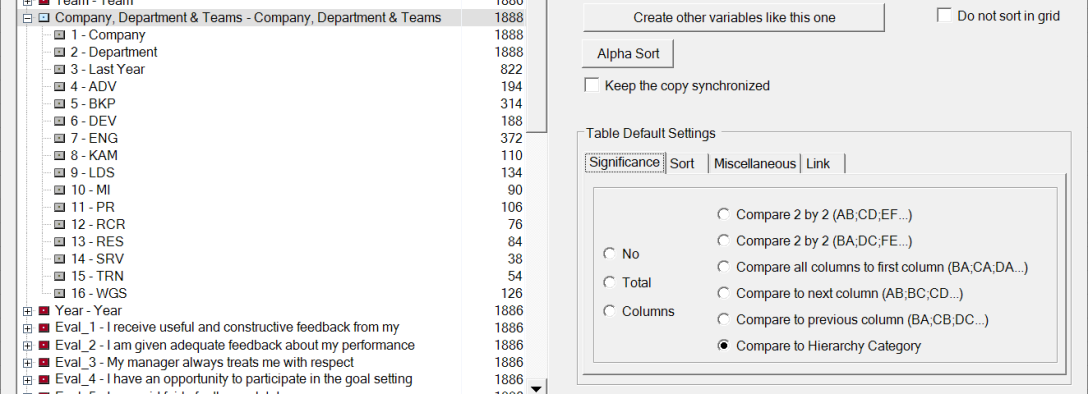
We also want to test significance compared to the current team. We can create that setting for each table we create, or we can define this as a 'Default Table Setting' for the variable. In that case the significance setting will automatically be applied to all tables we create with this variable in the banner. Select the variable and click the 'Default Table Settings' button to make the following setting:
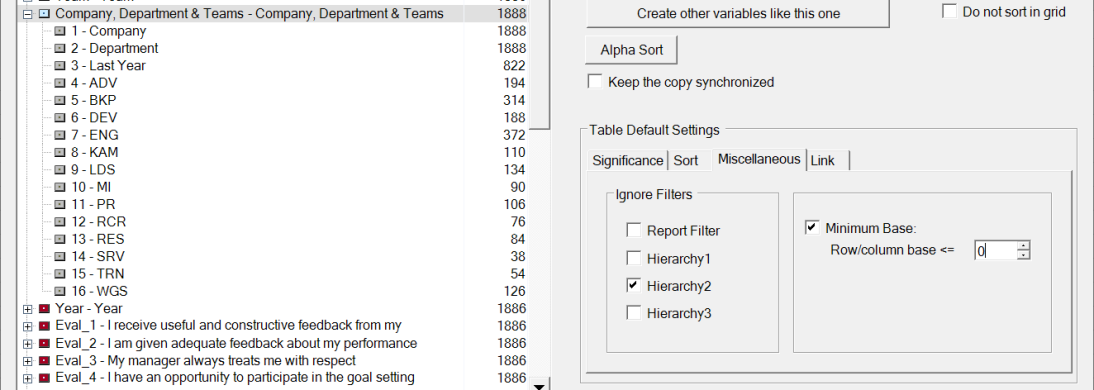
In the 'Miscellaneous Tab ' we have to specify we want to ignore the team filter, otherwise we will not get data for the other teams in the same department. At last we do not want to see empty columns (base 0). The empty columns are the teams belonging to other departments than 'Finance'.
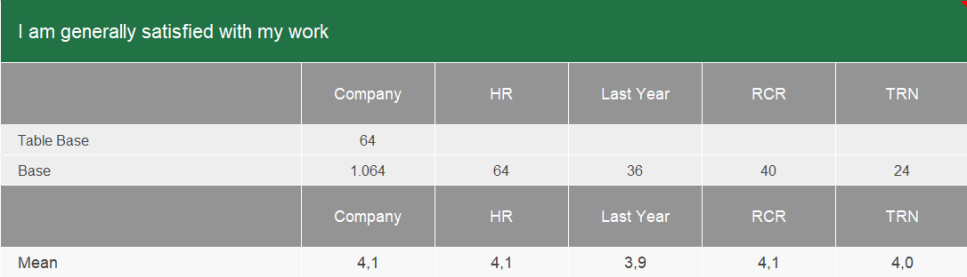
Now we are ready to create tables. Let's create a table showing the Mean for one of the scale questions. This done by selecting our new variable as banner variable and selecting a scale question as 'Cell summary' variable. Here is the result:
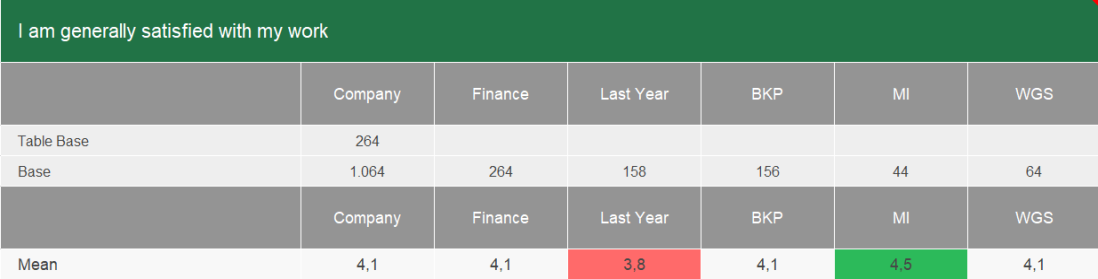
If we change the Hierarchy Filters to department 'HR' and to team ' RCR' the same table get's this content after updating it (Click 'Apply'):
This is just an example of what our Filtering System can be used for. In this case it is essential functionality to generate all team reports in one run using 'Repetitive Reports'