Explore & Discover
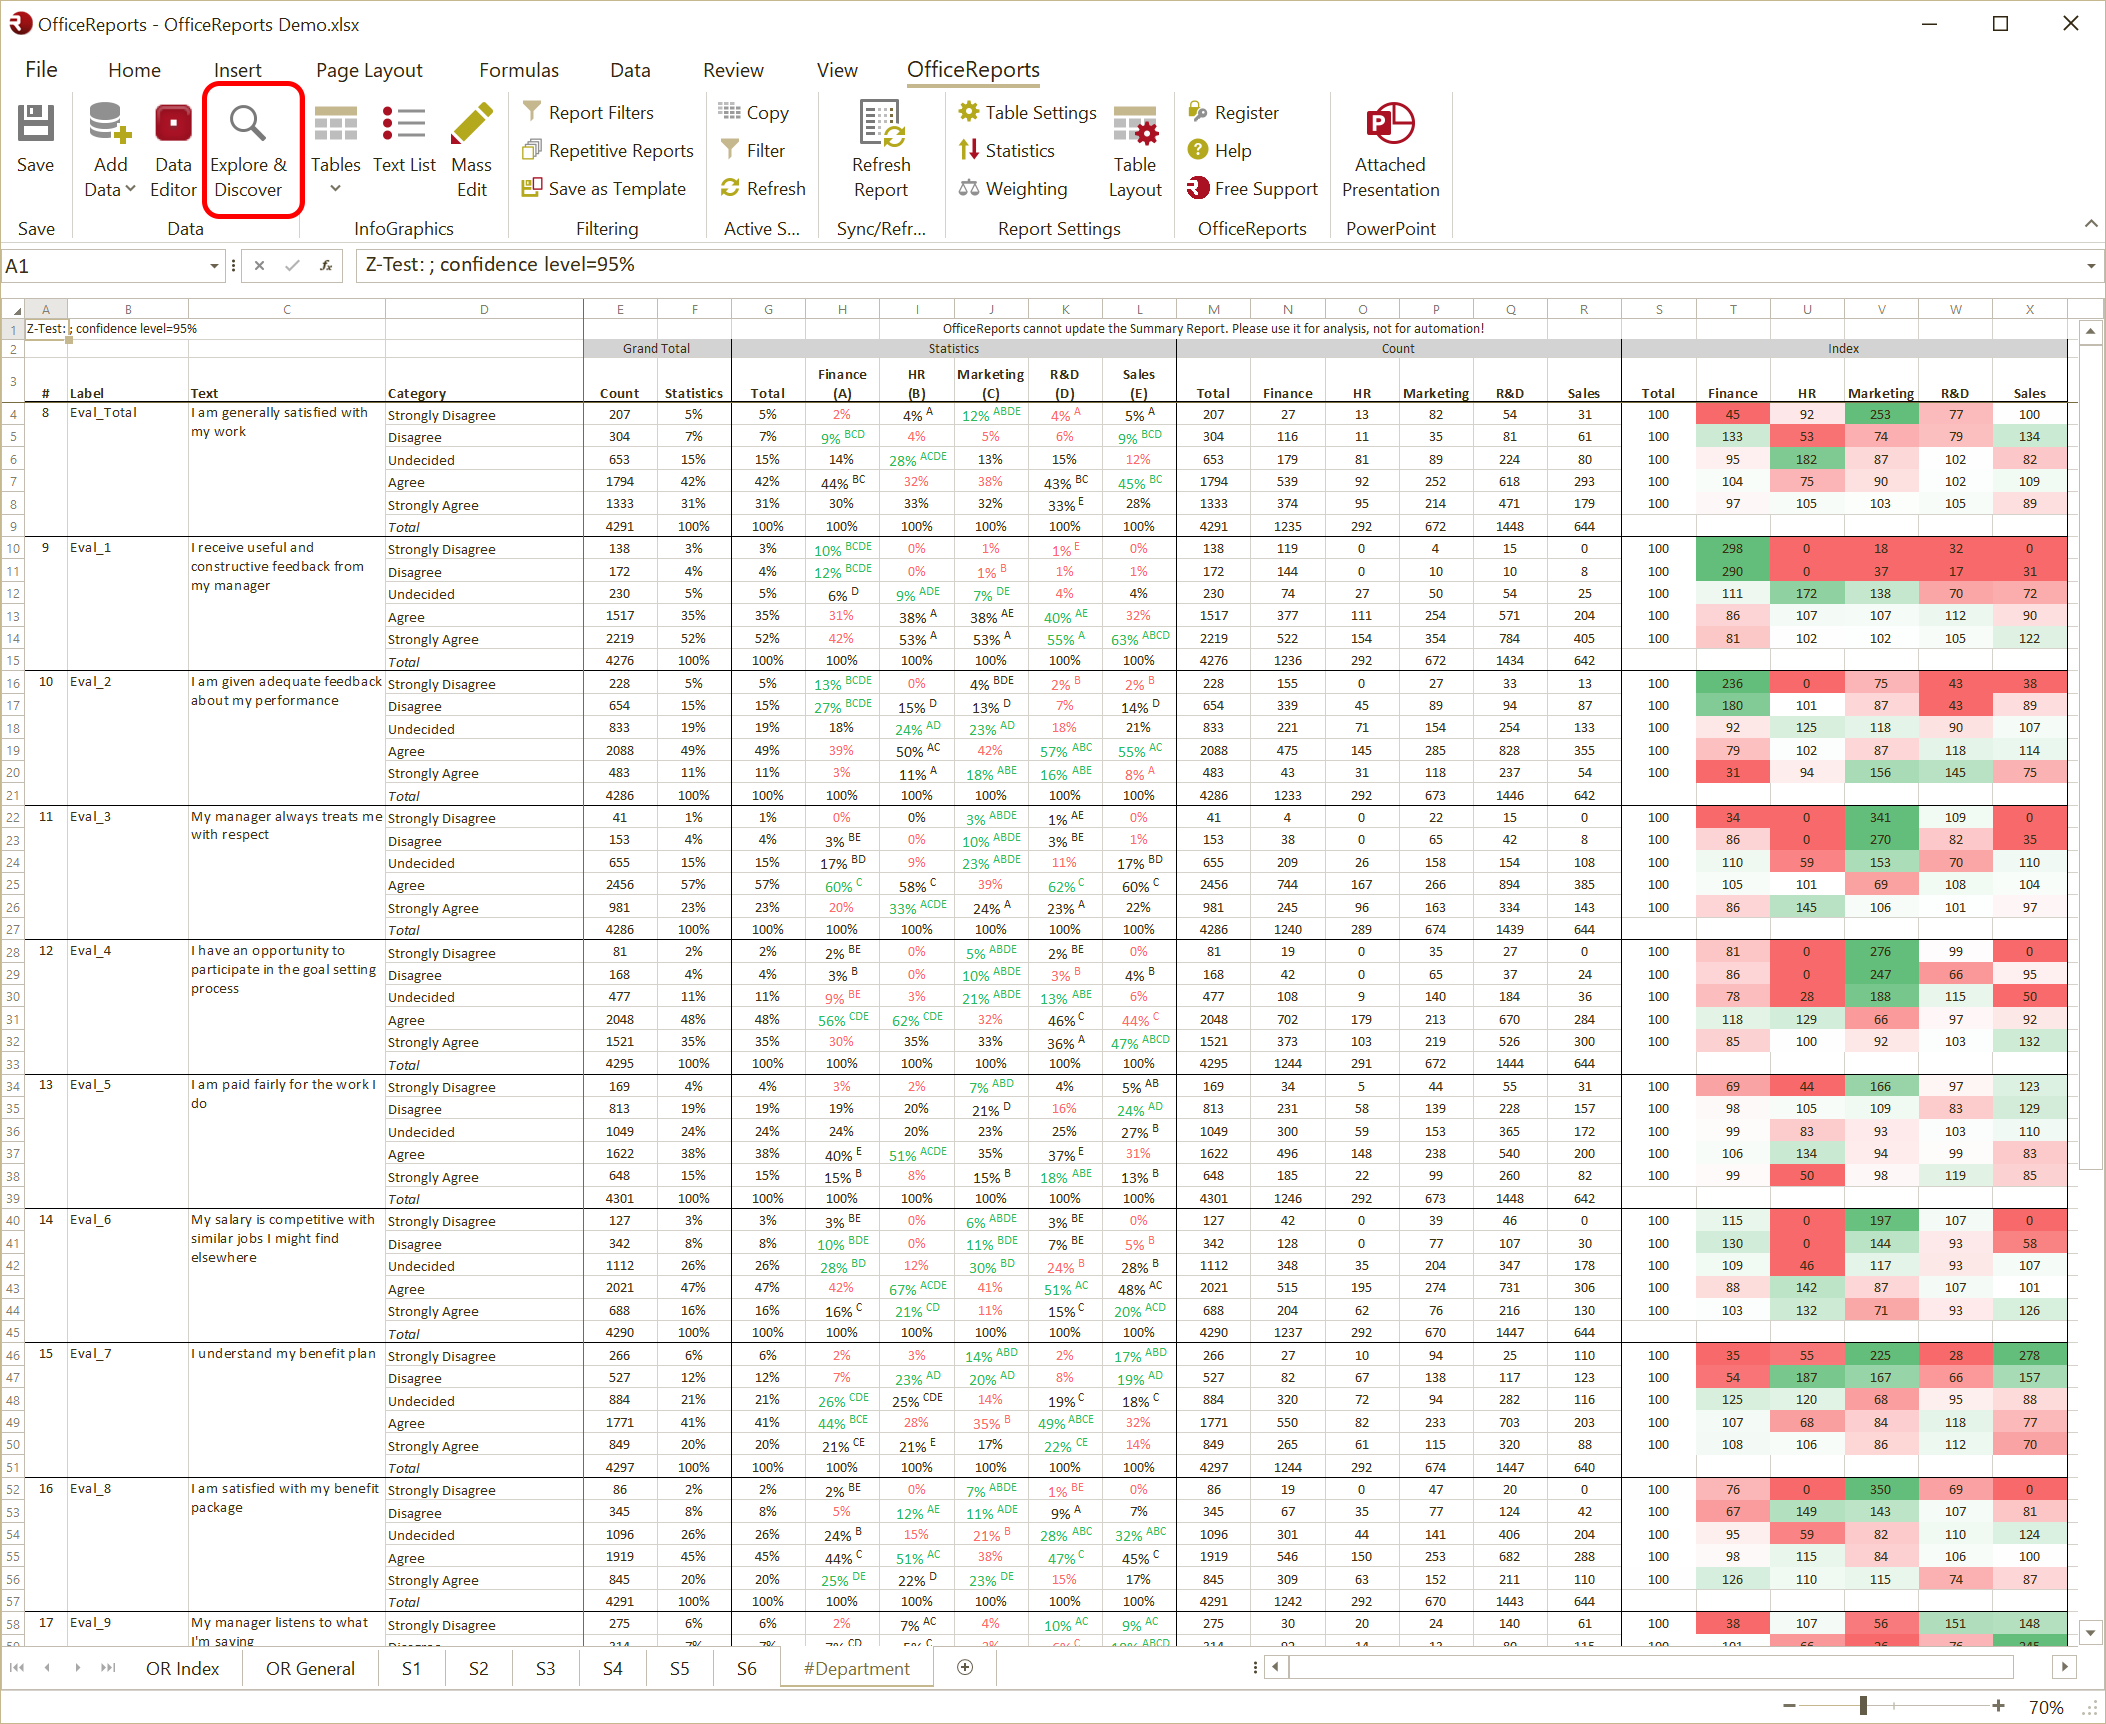
To get an overview of the results of your survey, you can start by creating summary reports. A summary report is a big table which can contain all your variables crossed by a specific banner variable. Summary reports contain both a crosstab and an index table for each variable, and you can define to calculate significance by setting the Default Table Settings (in the Data Editor) for specific variables used in the banner. It is also possible to define a filter for the complete report. Here an example of what it can look like: